I suppose most people can remember plotting equations onto graph paper at school. y = x produces a straight line. y = 2x generates a steeper line.
And then you try y = x2 and find that it generates a beautiful smooth ever-steepening curve, a parabola, while y = 1/x generates a hyperbola, a pair of curves that get closer and closer to the axes of the graph, but never quite reach them.
The following is a bit more complicated than y = x2 or y = 1/x, but it can still be explained in a few lines, and can still be understood by someone like me, whose maths ability hit a glass ceiling at about the sixth form level.
First, you let the y axis represent ‘imaginary numbers’ (that is: multiples of ‘i’, which is the notional square root of minus one), and you let the x axis represent real numbers (i.e. the ordinary kind: 1, 2, 1.5, -1, 101, 0.3: that kind of thing). Your graph is now what is known as a ‘complex plane’, because any so-called ‘complex number’ (that is: a combination of a real and an imaginary number) can be represented on it by a point.
Set the complex plane on one side, like pastry, for use later.
Now, consider the following formula zn+1 = zn2 + c. It took me a while to get the hang of this, but it is a formula for generating a sequence of numbers. The members of the sequence are labelled z1, z2, z3, z4 ….. etc, and all the formula tells you is that you generate each member of the sequence (starting with z0 = 0) by multiplying the previous member of the sequence by itself (i.e. squaring it), and adding a number of your choice designated c, which remains constant for the whole sequence.
So, if we take c as 1, the sequence we get is:
z0 = 0
z1 = 02 + 1 = 1
z2= 12 + 1 = 2
z3 = 22 + 1 = 5
….and so on
What you find is that starting with some values of c, such as 1, the sequence generates higher and higher numbers, as just shown, but for other numbers, the sequence is ‘bounded’, which is to say it oscillates between fixed points. For instance, if you set c as ‘i’ the sequence runs: 0, i, (-1 + i), −i, (−1 + i), −i… and then the same, on and on. Or, if you set it as -1, the sequence just bounces back and forth between 0 and -1.
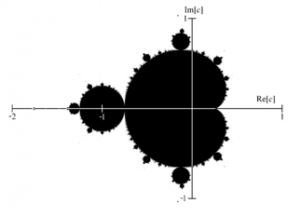
So now, returning to the complex plane you set aside earlier, you mark all the points on the plane that lead to a bounded sequence in black, and you leave the other points unmarked. And what do you get? Well, even at first sight it’s a lot more complicated than a parabola, but that’s only the beginning of it.
It is, of course, the Mandelbrot set, and, famously, its complication is without limits. Look at it at higher and higher magnifications, and you never reach the end of its curls and wiggles. Home in on what looks like a smooth line, and you see tiny shapes on the surface. Zoom in still closer, and these shapes start to resemble shapes that you had already seen at lower levels of magnification. Zoom in still more, and on the edges of these shapes too, new curls and wiggles start to appear. (There’s a video of it here). It is completely bottomless.
And now remember that this infinite complexity, this mad meaningless order, is generated by a comparatively simple rule which can be described in a few lines, as I have just done. This thing is not real. It has no objective existence in the world.
And yet it is not human-made either. These shapes are not the product of a human mind. They have been discovered, not created. This thing is neither real nor imaginary.
Think about it hard enough, and I reach a boundary beyond which my mind will no longer go, but across which I sense a strange awful place where mind and matter, real and imaginary, order and chaos, are not separate things at all.
Some people find the Mandelbrot set beautiful, and I suppose it is, but for me it is the beauty of a poisonous flower.
